The Trader’s Toolbox – Acquiring Technical Competence – Part 2 of 3
In “Part One” of this three-part series, we discussed how important Technical Analysis is for a trader’s survival in the world of foreign exchange. With market direction portrayed as a “50/50” proposition and broker fees demanding their pound of flesh, a trader can only make it if he maintains a “60/40” success rate over time. TA provides the “tools” to achieve this objective, when used wisely and after acquiring experience in how to gauge the accuracy of the signals that they produce.
Technical indicators form the backbone of this process, but pattern recognition is also a strong determinant in assessing a current situation for its potential. Yes, technical interpretations can be wrong. That reality is a given, but the entire point is to err with the odds in your favor – although financial losses could occur.
What do we mean when we say “pattern recognition”?
There is a wide assortment of patterns that form in our financial markets, beginning with lowly “candlestick” formations, graduating to waveforms and their specific components, and ending with a host of pricing histories that, by their shape alone, communicate a high probability for a likely outcome to occur. All of these shapes and forms are a guide as to how traders are thinking at any given moment.
Critics purport that TA, and more specifically, pattern formations are just one more self-fulfilling prophecy, signifying nothing about future price movements. Successful traders, however, understand that to know the tendency of the market under certain conditions or to capture a wisp of what is driving the thought processes in the minds of other traders or their software algorithms can be a vital part of their trading strategy.
What are “Candlestick” formations?
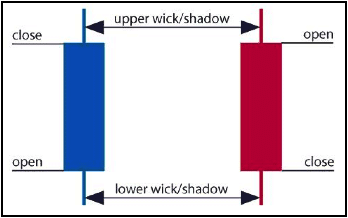
A candlestick formation consists of four major prices: high, low, opening and closing. The body of the candlestick bar is formed by the opening and closing prices. The body of the bar is left blank or given a specific color (Blue, in the example below) to indicate that the opening was lower than the closing price. Conversely, if the currency closes below its opening, the body of the bar is filled with a different color (Red, in the example below). The rest of the range for the period chosen is reflected by the length of the “wick” or the “shadow” on either end of the candlestick bar. A wick or shadow may also be called a “tail”. An example appears in the graphic below:
The charting style has its origins centuries back with Japanese rice traders. Trading tips arise when specific shapes repeat, when a long tail or bar forms, or when wicks shorten. Interesting names have been assigned to these forms like “The Hammer” or “The Shaven Head”. Each pattern sends a clue as to how buying and selling pressures are changing over time. Some shapes may be very “bullish”, while others are “bearish”. An accomplished forex trader, attune to these signals, will conceive a strategy, appropriate for each signal grouping.
Here are just two examples from an Internet tutorial:
 Three White Soldiers: A bullish reversal pattern consisting of three consecutive long white bodies. Each should open within the previous body and the close should be near the high of the day.
 Stick Sandwich: A bullish reversal pattern with two black bodies surrounding a white body. The closing prices of the two black bodies must be equal. A support price is apparent. Good opportunity for reverse.
You need not be an expert in candlestick recognition to be able to trade effectively, but every little bit helps. Forex trading depends to a high degree on making quick observations, and then executing a planned strategy to reap gains in a very volatile and high-risk market. The goal of a trader is to find an “edge” that can be used for advantage, a “must have” if they are to be successful over the long term.
What work is important in the study of waveforms and their components?
Newcomers to TA should ignore the impulse to avoid it at all costs because it may seem overly daunting or too difficult at first blush. There are literally mountains of books on the topic, but understanding the basics is all that is necessary to get a grasp of the primary benefits offered. There is always something new to learn from the work of other pioneers in the craft. One such “pioneer” was Ralph Nelson Elliott.
Elliott was born in 1871 and is the “father” of Elliott Wave Theory, which, although appearing overly complex, can actually get a beginner started in the right direction. After a lengthy examination of the DJIA, Elliott postulated that the ups and downs of the stock market were in tune with similar wave-like actions in nature. He studied the properties of trending markets, suggesting that the waveforms were repetitive, but the amplitude or period of the wave could vary across the spectrum. After years of research, he published his approach to discerning the secrets of pricing behavior, the Elliott Wave Principle.
His studies have stood the test of time. Many traders have embraced his unique tools to predict market movements with a high degree of accuracy, but many also decry his methods as being far too complex and subjective in nature. Elliott proposed that the market vibrates in natural rhythms. His basic premise is that trends unfold in a standard pattern of five waves in one direction (an “impulse” wave), followed by three waves counter to that trend (a “corrective” wave). Directions can start up or down, but Elliott defined three rules that cannot be broken:
- Rule #1: Wave 2 can never retrace more than 100% of Wave 1;
- Rule #2: Wave 4 can never end in the territory of Wave 1, and
- Rule #3: Wave 3 can never be the shorter than Wave 1 or 5.
Like an onion, there are varying levels of complexity, but the basics can be discerned from the following chart example for the “EUR/USD” currency pair:
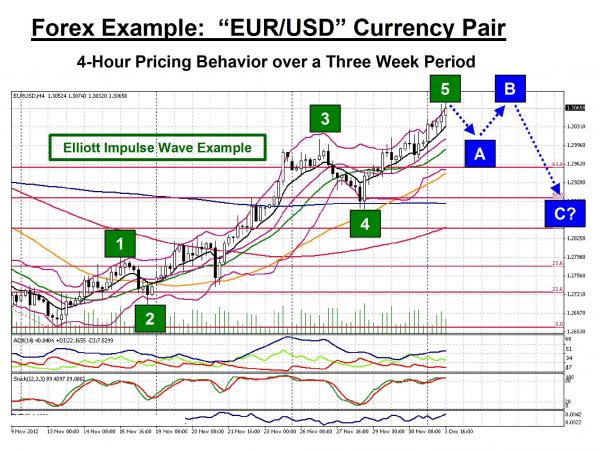
The five “legs” of the Elliott impulse wave are clearly visible, with a strong “3” component and all three “fixed” rules being followed to the letter. The expectation for the trader is that a “corrective” wave will follow the “A-B-C” pattern depicted on the chart. Let’s revisit this chart a week later to see what transpired:
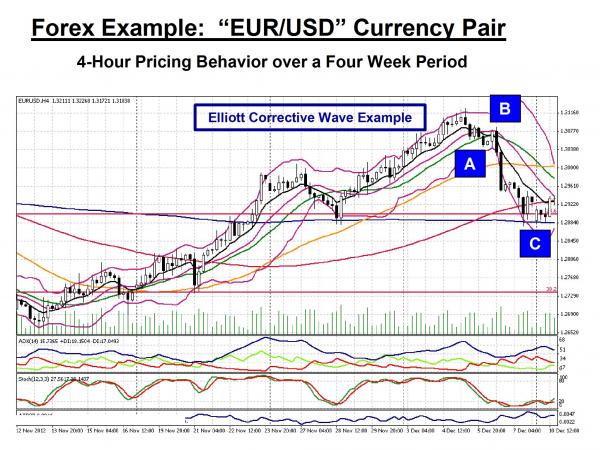
Voila! The Elliott corrective wave formation appeared and set the foundation for another drive to higher ground, which actually did take place in the weeks that followed.
What are other basic pricing patterns that a beginning trader should recognize?
Aside from the candlesticks themselves, there are other more familiar patterns that can be discerned from pricing action over time. These “shapes” generally fall into five categories as follows:
- Ascending and Descending Triangles: Prices form a triangle where either a resistance or support level forms a horizontal ceiling or floor, but the opposite side of pricing is sloped toward a convergent point with the respective ceiling or floor. For the “Ascending” version, prices keep testing the ceiling until a positive breakout occurs, a bullish pattern. The “Descending” version is bearish;
- Symmetrical Triangle: Much as above except that the prices move sideways with two angled lines that point to an apex. In this case, investors cannot decide which way the value will go, but once it does break out, then everyone jumps on the bandwagon;
- Double Bottom or Top: Patterns of this type form either a “W” for a Double Bottom or an “M” for a Double Top. In each case, a breakout in the direction of the last leg of the pattern is suggested;
- Triple Bottom or Triple Top: What if the previous pattern does not react as you suspect? The answer is that they may add one more leg, but the forecast is still the same. More legs may form, but a breakout in a predictable direction is the consistent result;
- Head and Shoulders: One of the more popular trading patterns involves the formation of three peaks, where the central spire is taller than the accompanying peaks on either side. The diagram below illustrates the pattern with the additional notations for the “Neckline”, “Pattern Height”, and “Target”. The pattern is notorious for signaling a downward drop, the optimum signal for an experienced short-seller.
Let’s take the last example to illustrate how these patterns convey information:
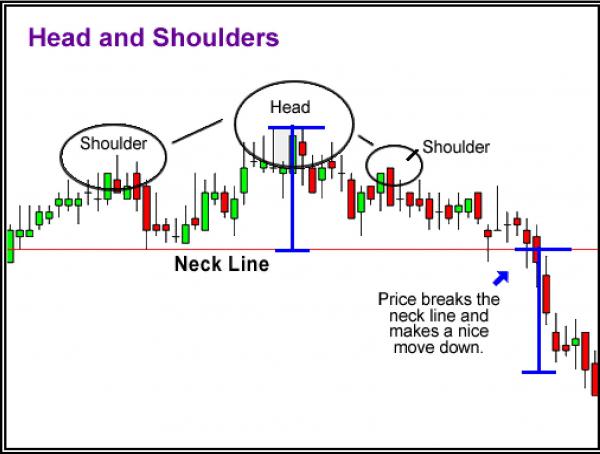
A Head-and-Shoulders is a bearish reversal pattern that is familiar to technical analysts and forex traders. It consists of a series of three consecutive rallies, such that the first and third rallies, the “shoulders”, have approximately the same height and the middle one, the “head”, is the highest. The support line formed by a line connecting the bases of the two shoulders is known as the “neckline”. The neckline need not be exactly horizontal. In most cases, it may be up or down, but most forex traders believe the signal is more reliable if the slope is tilted downward, thereby confirming an impending fall in price.
When the neckline is broken, the downward expectation price point is equivalent to the amplitude of the “head” from the “neckline”. A Head-and-Shoulders can also form in reverse, such that it is a bullish reversal pattern. The diagram shown above, taken from a popular forex tutorial on the Internet, illustrates the various characteristics of this easily recognizable chart pattern. Each of the above five familiar patterns can be reversed, i.e., they apply whether in a rising or falling market. It would behove the aspiring student to read more about these shapes from a separate search on the web.
Concluding Remarks
Pattern recognition is just one more technical tool that belongs in a trader’s toolbox. Coupled with technical indicators, it provides additional confirmation when assessing the odds of a current situation in the forex market. The more confirmations that support your interpretation of the attitude of the trading community, the better off you will be in preparation for your next market move. Understanding key support and resistance levels is the remaining “tool” in this triumvirate. It is also vital to remain aware of the risks involved when trading and to be conscious of the fact that losses could occur.
The final part in this series will touch on this topic and show you how to put everything together to attack the market. Stay tuned!
Next >> Part 3: Understanding Support and Resistance levels >>
Previous << Part 1: The importance of Technical Analysis in Forex Trading <<