The Fibonacci Sequence For Forex Traders By Joshua Martinez, Head Market Analyst at Market Traders Institute
I was first introduced to the Fibonacci sequence by my father, Jared Martinez (CEO and founder of Market Traders Institute), who to this very day believes that these numbers were sent to him straight from heaven. I honestly didn’t get their powerful insight into the forexmarket until long after that point. But, from that point of enlightenment on, my trading game was changed forever.
In a nutshell, Leonardo Fibonacci was a mathematical genius and author who lived back in the 1100s AD. He noticed a natural numerical rhythm that occurred in various places of the world. This sequence is now used to predict the natural ebb and flow in the currency markets quite accurately through equations that can be applied to some foreign exchange charting software such as MTI’s 4.0 Charting software.
How it works, is that the sum of the previous two numbers in a sequence will always equal the next number in the sequence. Take the chart below for instance:
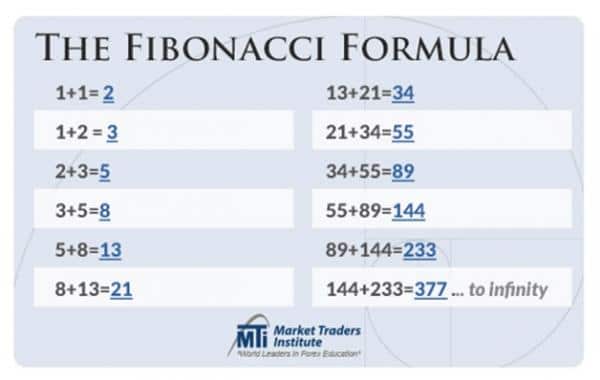
In the chart, we can see how the flow of the numbers never ends. In reality, it’s usefulness in the forex market works in much the same way. When you begin to divide and find the square root of the Fibonacci ratios you will begin to see important numbers that represent market levels, which could be used to identify market retracement and extension levels. For example:the .382 line equals 38 percent, .50 equals 50 percent, .618 equals 62 percent, .786 equals 79 percent, .86 equals 86 percent, 1.18 equals 118 percent, 1.27 equals 127 percent, 1.618 equals 162 percent, and the 2.618 level equals 262 percent.
The Fibonacci sequence numbers are used to predict the wave movement of the market. For instance, when the market establishes a low followed by a proper high,the low will represent the zero percent level and the high will represent the complete 100 percent level. Because the market moves in waves, traders would then set expectations that the market will pull back and form a low higher than the zero percent mark. Depending on the market price level of that low,using the Fibonacci sequence, traders can then predict where the corresponding high will form. For example, the Fibonacci sequence states that if the market pulls back from 100 percent to the 38 percent level, 50 percent level, or the 62 percent level/price point based on the initial movement, then we should expect the market to extend to the corresponding 1.618 or 162 percent point of the previous low and high starting from the initial starting low point (or zero percent level). See the image below for one example.
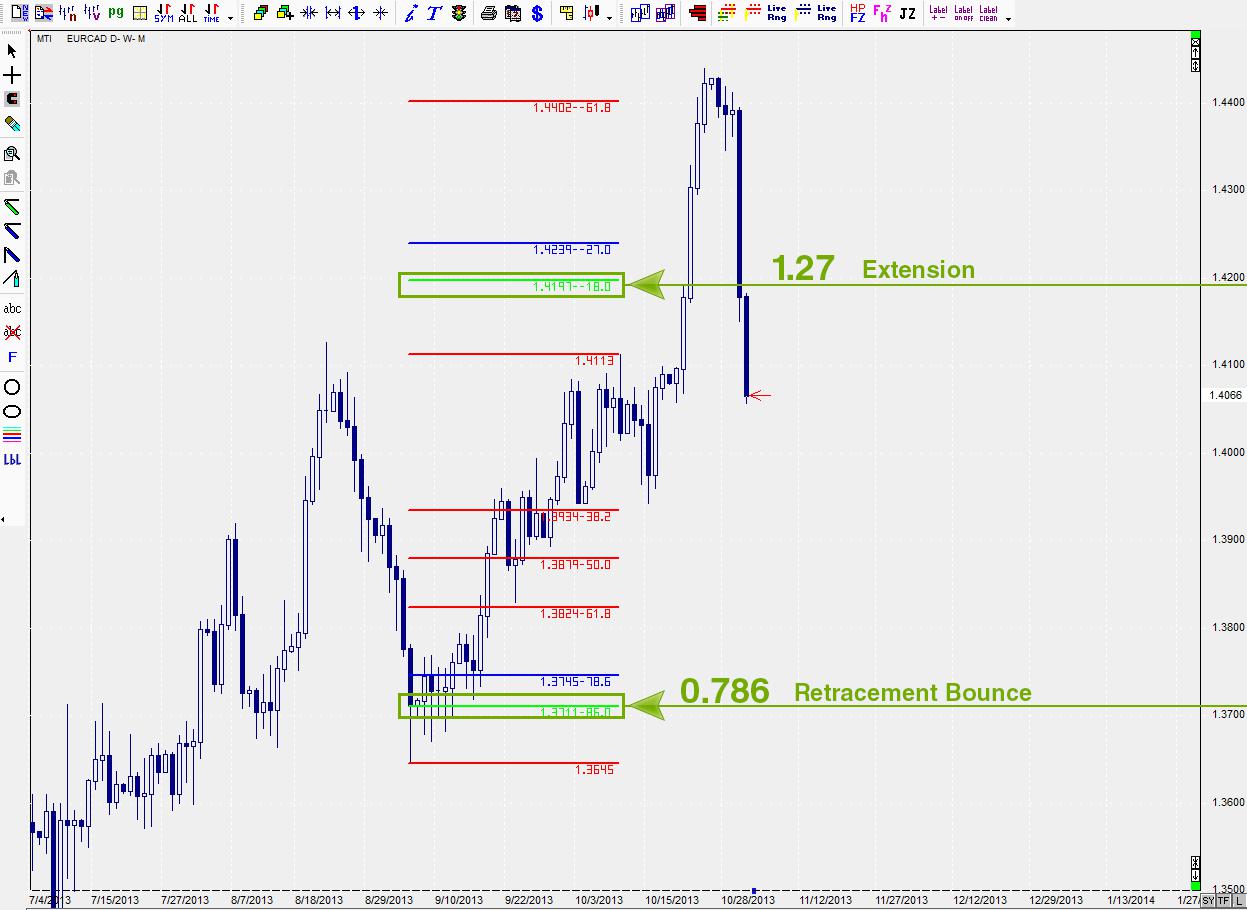
If the market retraces to the .786 or 79 percent point, then we should expect the market to extend to the corresponding 1.27 or 127 percent point. This represents 127 percent of the combined low to high or zero percent to the full 100 percent of the previous movement. Now, some charting software platforms that are out there simply show these levels and traders must memorize which levels work as pairs or, in other words, which low point level and high point level correspond to one another. With MTI 4.0 Charting software, these levels are related through the level’s coloring as shown above so that there is less confusion. You can use this knowledge through your platform as well.
From our studies, the market follows the Fibonacci sequence pretty much to the pip. When the market hits these crucial levels, that is where decisions are made and we look to enter in either a buying or selling position with eyes to the corresponding market level as is identified through the Fibonacci sequence.
To learn more about the Fibonacci sequence and how you can apply it to your charts and trades, click here: http://goo.gl/BwSd8i
Real-Life Trading Perspective:
Just, MTI in general, what I think I’ve learned the most is really understanding the Fibonacci sequence. It’s probably been the biggest light bulb for me in terms of changing the way I trade. Taking comfort in knowing that you have a safety zone to put your stop loss, which is probably the scariest thing for somebody just getting started that only risks 15-20 pips when the market can move hundreds of pips. So to understand why the market moves the way that it does, the Fibonacci sequence helps so much. MTI’s strategy on Fibonaccis is far more thorough than anything I’ve ever seen in terms of other workshops or what have you.
-MTI Student, Chris Pulver