The Trader’s Toolbox – Acquiring Technical Competence – Part 1 of 3
Do you aspire to be a competent currency trader? If you have been asking yourself this simple question, then it should not come as a shock that preparation is only a first step in achieving that goal, and competence only comes from time invested in the process. The accent on “competence” is key because the failure rate among beginners in this craft is high, nearly 70% by most accounts, and, even if modestly successful, only 10% stay with it for any length of time.
These odds may not sound great, but the primary reasons for the high level of “crash-and-burns” have to do with impatience and inexperience. The general populace is lazy. Delayed gratification is a thing of the past. Instant fame and fortune with no investment of time is the mantra of these “wannabes”, so it is no wonder why there are so many casualties in forex trading.
As with any other profession in life – knowledge, experience, and emotional control are key characteristics for traders to possess. The first two require effort on your part, and the last one is achieved from mastering the first two prerequisites by learning to approach the market in a disciplined fashion, guided by a “step-by-step” trading plan that dictates your every move before, during, and after a position is closed.
Knowledge comes from reading, taking forex tutorials, and attending forex seminars where mentors can guide your early education. Experience comes from hours of practice on “free” demo systems provided by your broker (see a list of our recommended brokers that offer demo accounts). It is here that you determine if you are cut out for trading, develop your trading strategy, and achieve the consistency and confidence you will need to attack the real forex market in real time.
What is the first lesson to learn about market pricing behavior?
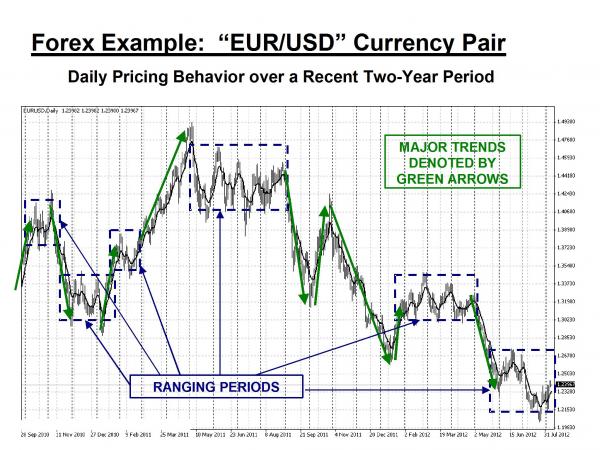
Financial markets, including the forex market, are either “trending” or “ranging”. The above chart depicts nine trending moves and six ranging periods for daily “EUR/USD” pricing behavior over a two-year interval. A “Trending Market” is one where prices are moving in one direction, either up or down, but not sideways. There may be several small price gyrations, but nothing large enough to impact the general direction of the trend. Trends can last for minutes or hours, or even weeks or months for longer-term trends, but trends account for a minority of the actual timeline, only 25% in the chart. See the live EUR/USD chart now.
A “Ranging Market” is one where the price is moving back and forth between a higher price and a lower price. It is commonly referred to as range bound, choppy, sideways or flat market. The higher prices form a resistance line that prevent the price from rising further, and the lower support line prevents further downward movement. The range of prices witnessed during a ranging market may be small or large, but if a smaller range exists, the market is said to be in chop or moving sideways.
What causes these market conditions to exist in the first place?
Any “Forex 101” tutorial will tell you that fundamental information, whether economic, financial, political, or crisis related, is what moves a market. The community of traders, from large banks and hedge funds to the lowly individual retail forex trader, reacts to new information on the street, and then the race is on to find a new equilibrium level for prices. When uncertainty and indecision prevail, the market will resume another ranging pattern until stimulated once again by important data releases or events.
How does a trader take advantage of these moves in the market? Forex traders often employ oscillators, a form of technical indicator, to signal when prevailing trends are about to reverse themselves, learn about Forex signals. They may also use another indicator, like the MACD, to confirm the signal given by the oscillator. While letting a winning position run during a positive trend, a wise forex trader will also set a stop-loss order or a trailing-stop to protect against his downside risk from adverse price movements.
It is often said that the primary “toolbox” for a trader is “Technical Analysis”, or “TA” for short. TA is the accepted way for interpreting the mindset of the trading community at a point in time, assessing the odds for future directions in the market, and then guiding a trader’s entry and exit from the fray.
What is the origin of Technical Analysis and what are its component parts?
Technical Analysis is a discipline that studies charts of past price behavior for a security, commodity or currency in order to forecast future price performance. It is one of the most significant tools available for projecting predictable price direction in our financial markets. It does have its share of critics, but successful traders swear by these analytical tools and depend upon them for their very survival.
This form of analysis has its roots in Europe and Japan when commodity traders noticed patterns in commodity price action. It became accepted that price was the ultimate result of all market forces. The seasonality of crops suggested that the repetition of previous trends could provide clues of current and future behavior. Lastly, the notion of momentum also evolved that implied that trends would last for a period of time before buying and selling forces were able to balance out and reshape the price level.
The primary strength of technical analysis is its flexibility. What you learn can be used for the currency pair of your choice, or for another currency pair. It can be used across markets, and more importantly, across different timeframes. What works for daily charts will also apply to 15-minute or one-hour charts for that matter. Today’s software does all the work. You, as a trader, then have more time to interpret their results and search for the all-important trend. “The trend is your friend”, is often heard amongst the trading community.
Technical analysis is often said to be a unique blend of pattern recognition, an understanding of support and resistance, and indicator interpretation. The remainder of this article will focus on technical indicators, while the next two articles in this series will discuss the former items and how to put TA into practice.
Read more about the origins of technical analysis.
What are some examples of popular technical indicators?
Many forex traders enjoy researching and testing one of the thousands of technical indicators that have been developed over the years. It is almost like panning for gold or searching for the “Holy Grail”. Conventional wisdom, however, suggests that there is no “Holy Grail” to be discovered, that using too many indicators is counterproductive, and that an effective trader always knows to focus on a few “tools” and to learn them well.
Charting software offers a host of indicator options, but the chart below depicts a few preferred favorites. Beauty is in the eye of the beholder. The idea is to specialize in a few “tools”, thereby becoming proficient in their use and peculiarities, as with any tool.
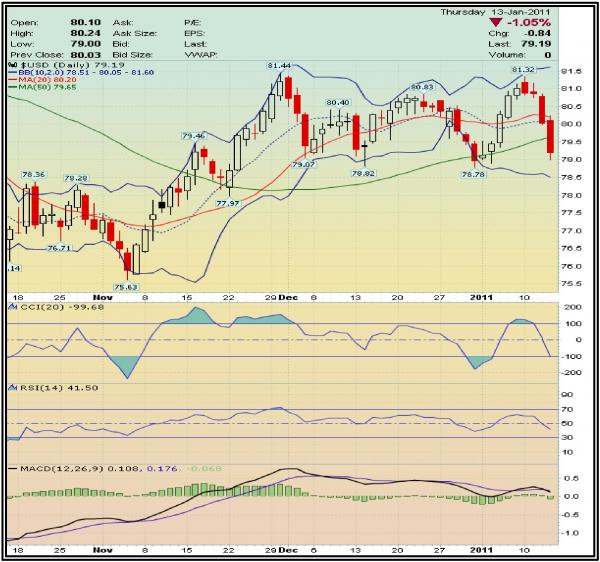
Technical Analysis can be described as a unique blend of pattern recognition and indicator interpretation. The above chart presents tools that have been chosen to support both activities. Pattern components appear in the top half, reflecting direct pricing behavior. Two oscillator (leading) indicators are depicted in the bottom portion, along with a moving average (lagging) indicator. Indicators take pricing data, manipulate it according to specific mathematical algorithms, and then provide high probability signals for guiding when the trader should enter or exit a market.
There are six “tools” displayed in the diagram. Here is a brief recap of each one (more information on these will be found in Part 2 and 3):
- Candlestick Formations: These little pricing “bars” offer a wealth of information related to trader confidence and market direction. Pattern recognition began many centuries back with these forms, and a prudent trader would gain immensely from learning the basics in this area;
- Moving Averages: A simple moving average and its crossover of a slower moving average can suggest changing attitudes in market behavior;
- Bollinger Bands: Statistical calculations are required, but your software will do all of the work. These bands play “music”, like an “accordion” andcan telegraph a sudden reversal or breakout in pricing behavior;
- Commodity Channel Index (CCI): This indicator signals overbought and oversold conditions, as well as being more sensitive than other oscillators;
- Relative Strength Index (RSI): This popular momentum oscillator signals similar conditions, as does the CCI. The primary issue is timing. It may signal imminent change is in order, but it does not indicate exactly when the change will occur. Experience helps to ferret out “false signals”, and using a lagging indicator for trend confirmation, like the MACD, is highly advised;
- Moving Average Convergence-Divergence (MACD): The MACD is the favored “lagging” indicator used in conjunction with a leading indicator to confirm the potential timing of an imminent reversal or breakout.
Concluding Remarks
Technical indicators can be a valuable part of your trading strategy, but they were never meant to be perfect. They can send out false signals from time to time. However, experience in their use and interpretation can lead to a level of consistency. Coupled with indicators, pattern recognition and principles of support and resistance round out the “triumvirate” of Technical Analysis.
The next two articles in this series will delve into these topics and focus on how to use the complete set of tools effectively when currency trading. However, before proceeding, it is important to consider the risks associated with trading and that losses are indeed likely to occur. Stay tuned!
Next >> Part 2: How to get the edge with Technical Analysis >>