The Trader’s Toolbox – Acquiring Technical Competence – Part 3 of 3
In the first two episodes of this three-part series, we discussed the importance of Technical Analysis and how the tools of this craft can provide the “edge” that every trader needs in order to survive and thrive in today’s frenetic forex market. Specific technical indicators and pattern recognition form the foundation of this art form, but a wise trader can even get by if he understands only the subtle principles behind support and resistance levels in pricing behavior.
Traders have long recognized that trends occur about 25% of the time, while prices tend to range between obvious “boundaries” for the remaining 75%, pausing until events or fundamentals change to signal a new direction. How does the market determine where these so-called “boundaries” fall in the scheme of things? There is no magic “Mr. Market” that picks these barrier limits. Traders determine these junctures, usually based on what are known as Fibonacci ratios or on a host other guiding reasons, tied to previous price behavior. These “barriers” or “boundaries” are known as Support or Resistance levels.
What do Support and Resistance levels say about a market situation?
Assume for the moment that the market is trending in an upward fashion. You stake a position, but how do you know when the market might reverse? We have already learned that many indicators or patterns may suggest that a reversal is imminent, but how do we measure at what point on the chart this change will occur? We know from experience that there is a “ceiling” or point where further rises are blocked, a level of resistance, so to speak.
Resistance is a term used in technical analysis to describe a price level in a currency where selling pressure for the asset exceeds the momentary buying pressure, forming a ceiling that blocks future price movements in the upward direction. The opposite of resistance is Support. Similarly, it is the level where buying pressure begins to exceed selling pressure, thereby establishing a “floor” beneath which prices will not fall.
Technical analysts have developed many tools to ascertain these levels since they signal appropriate entry and exit points that a forex trader can use to his advantage. Many forex traders rely on various wave theories that project these levels at varying points on a currency-pricing chart. Proponents of Elliott Wave Theory use proportional retracement ratios, sometimes based on Fibonacci intervals, or the “Fibs”, to determine consistent projections for both resistance and support. The wise forex trader then places orders based on these price forecasts to profit from these expectations. Software has been developed that performs the necessary calculations. Typically, resistance and support are displayed (abbreviations are R and S), as in the following example:
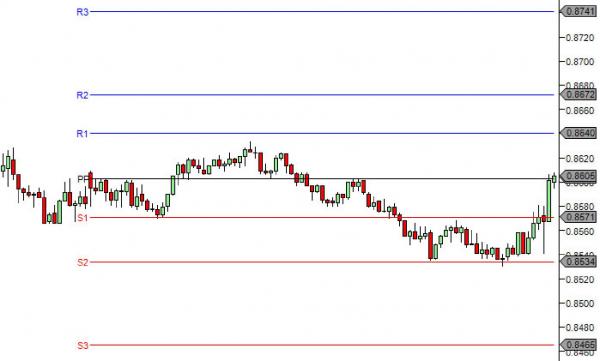
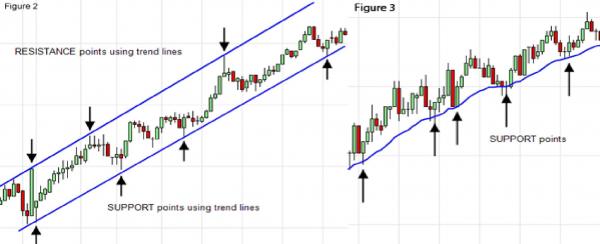
As you can see, prices form resistance and support levels. To some extent, these levels form because traders have set stop loss orders at these points from experience, and it takes a bit of time to clear out these stops, after which a new trend begins. Support and Resistance need not be horizontal, as the exceptions below depict:
What are Fibonacci Ratios and how can they be used?
Wave theory has also developed ingenious ways to use what are called Fibonacci Numbers. These numbers and their ratios appear in nature and have been referred to as the golden ratio or the golden spiral. Traders have used Fibonacci numbers for years to develop trading algorithms, applications and strategies. Forex traders use Fibonacci support and resistance lines, or “Fibs”, as an analytical way to determine the best entry and exit points for a trade or the placement of stop losses.
Forex traders anticipate “retracements”, those levels where the price of a currency will predictably move with some consistency. If a currency price moves “A” in one direction, and then returns moving only “B” in the opposite direction, the “B” movement is the retracement. The ratio of “A/B” typically approximates one of the key Fibonacci ratios of 23.6%, 38.2%, 50%, 61.8% and 100%. Software tools perform the necessary calculations and overlay the results on a currency chart for the trader. Some forex traders regard the “Fibs” as their most trusted form of technical indicator.
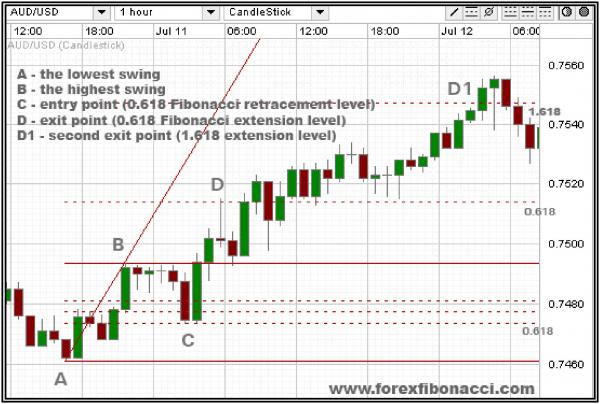
Fibonacci tools come in horizontal, channel, and fan varieties, but the most common is the former. In the diagram below, the “Fib” tool would start at point “A” and be dragged to point “B”. The dotted lines would be entered automatically. In this case, the trader would anticipate that the market would reverse at “C”, after a retracement of 61.8% of the previous rise. A conservative exit would be at point “D”, but an aggressive trader might allow his winner run to the “D1” exit level.
Additional reading: Click here to read about the Fibonacci Sequence from Joshua Martinez, Head Market Analyst at Market Traders Institute
How does a trader put all of these TA principles together to assess his odds?
Let’s review briefly what TA principles can be used as “tools” in a trader’s toolbox. We have focused on three key areas:
- Indicators: These come in a variety of types, each devised for a given purpose to assess market conditions, whether oversold or overbought, and to suggest whether momentum is modifying or that a reversal is imminent. It is best to focus on only 2 to 3 indicators at one time, learn their idiosyncrasies, and then leverage your knowledge for advantage;
- Pattern Recognition: Various shapes and forms in the market can also signal future pricing directions with a high degree of accuracy. Traders should combine these insights with others to develop his take on market conditions and how to proceed to profit from the circumstances at the moment;
- Support and Resistance Levels: Lastly, software tools are available that can predict specific price levels where the market may change its course, if only for a moment or for longer periods, as well. A host of traders attack the market with only these tools at their side, picking off quick gains as prices gyrate between these accepted “boundary” levels, a process sometimes referred to as “trading the fibs”.
Now let’s take a real life example from the market and follow how these “tools” can operate together for the trader’s ultimate benefit.
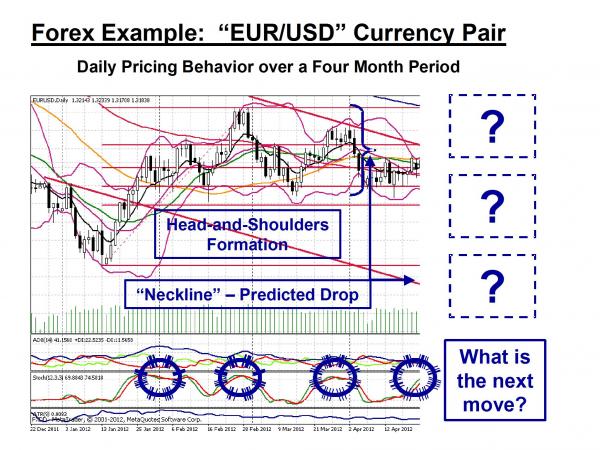
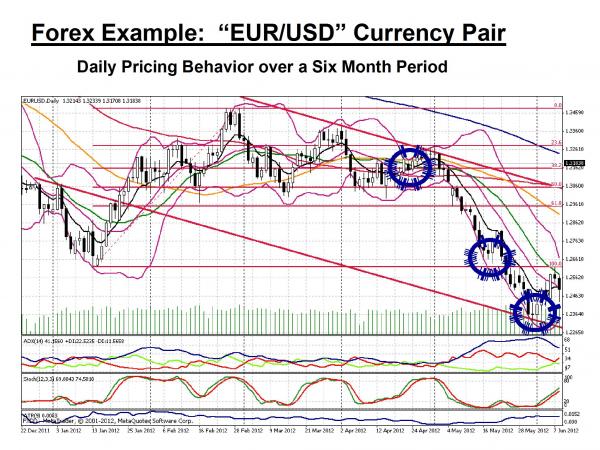
Here we have the “EUR/USD” currency pair during the first half of 2012, presented on a daily basis with annotations added. Your objective, as a trader, is to determine the odds for the next move in the market and to capitalize on it. What will the next move be? Let’s take a look at what the chart is telling us:
-
- A “Head-and-Shoulder” formation, right out of the textbook, has come together over months of trading;
The Slow Stochastic indicator, often preferred by forex traders over the more common RSI or CCI, has signaled overbought conditions at each “hump” of the “H&S”, and is signally another highpoint at the moment; - The “Fibs” have been added for the most recent major upward trend, signifying horizontal support and resistance levels;
- A diagonal downward channel of support and resistance, depicted by the diagonal red lines on the chart, has also formed;
- Lastly, the “Neckline” of the “H&S” formation suggests that a fall in prices might head down in the direction of the bottom Fibonacci ratio level and the diagonal channel line.
What is the interpretation to be drawn from this complex mix of technical data?
The “odds” are high that a drop is imminent on the order of 7% to 8%, representing an excellent opportunity to profit over the following month of activity. Selling the Euro short would have been the highly favored strategy in this situation. What happened next? Let’s take another look a month or so later:
Believe it or not, our prediction for the market was spot on the money! The market dipped to the expected “Fib” level, hovered for a bit, and then continued its downward track to the channel barrier. Markets do react as expected on many occasions, such as this one, but fundamental events could have easily spoiled this predictable outcome. The only protection for such an unexpected move would have been to place stop-loss orders at appropriate points to mitigate the upside risk.
Remember that we are always dealing with probabilities in the foreign exchange market. Nothing is ever perfect, errors in judgment will happen, but repetition often is the primary concept implicit with technical analysis. Recognize it in real time on a consistent basis and you, too, can earn the title of being a “Veteran Forex Trader” and live to tell your personal story of fame and fortune!
Concluding Remarks
This concludes our three-part series on “The Trader’s Toolbox – Acquiring Technical Competence”. Hopefully, these basic concepts will encourage you to expand your knowledge base on several of the topics covered in these articles. Technical Analysis may appear overly complex and too difficult a task to master, but a technician must continually practice his art, learning new skills along the way, checking in with a “mentor” from time to time for more in-depth guidance, and then moving to the next level of understanding that can only make you a more effective and consistent trader, your general goal as an aspiring forex trader. Hopefully, these helpful bits of insight will propel you on to further heights and success! Good Luck, and Happy Trading!
Previous << Part 2: Understanding Support and Resistance levels <<
Part 1 << Back to part 1 of this series on Technical Analysis in Forex Trading <<
- A “Head-and-Shoulder” formation, right out of the textbook, has come together over months of trading;